Metrics
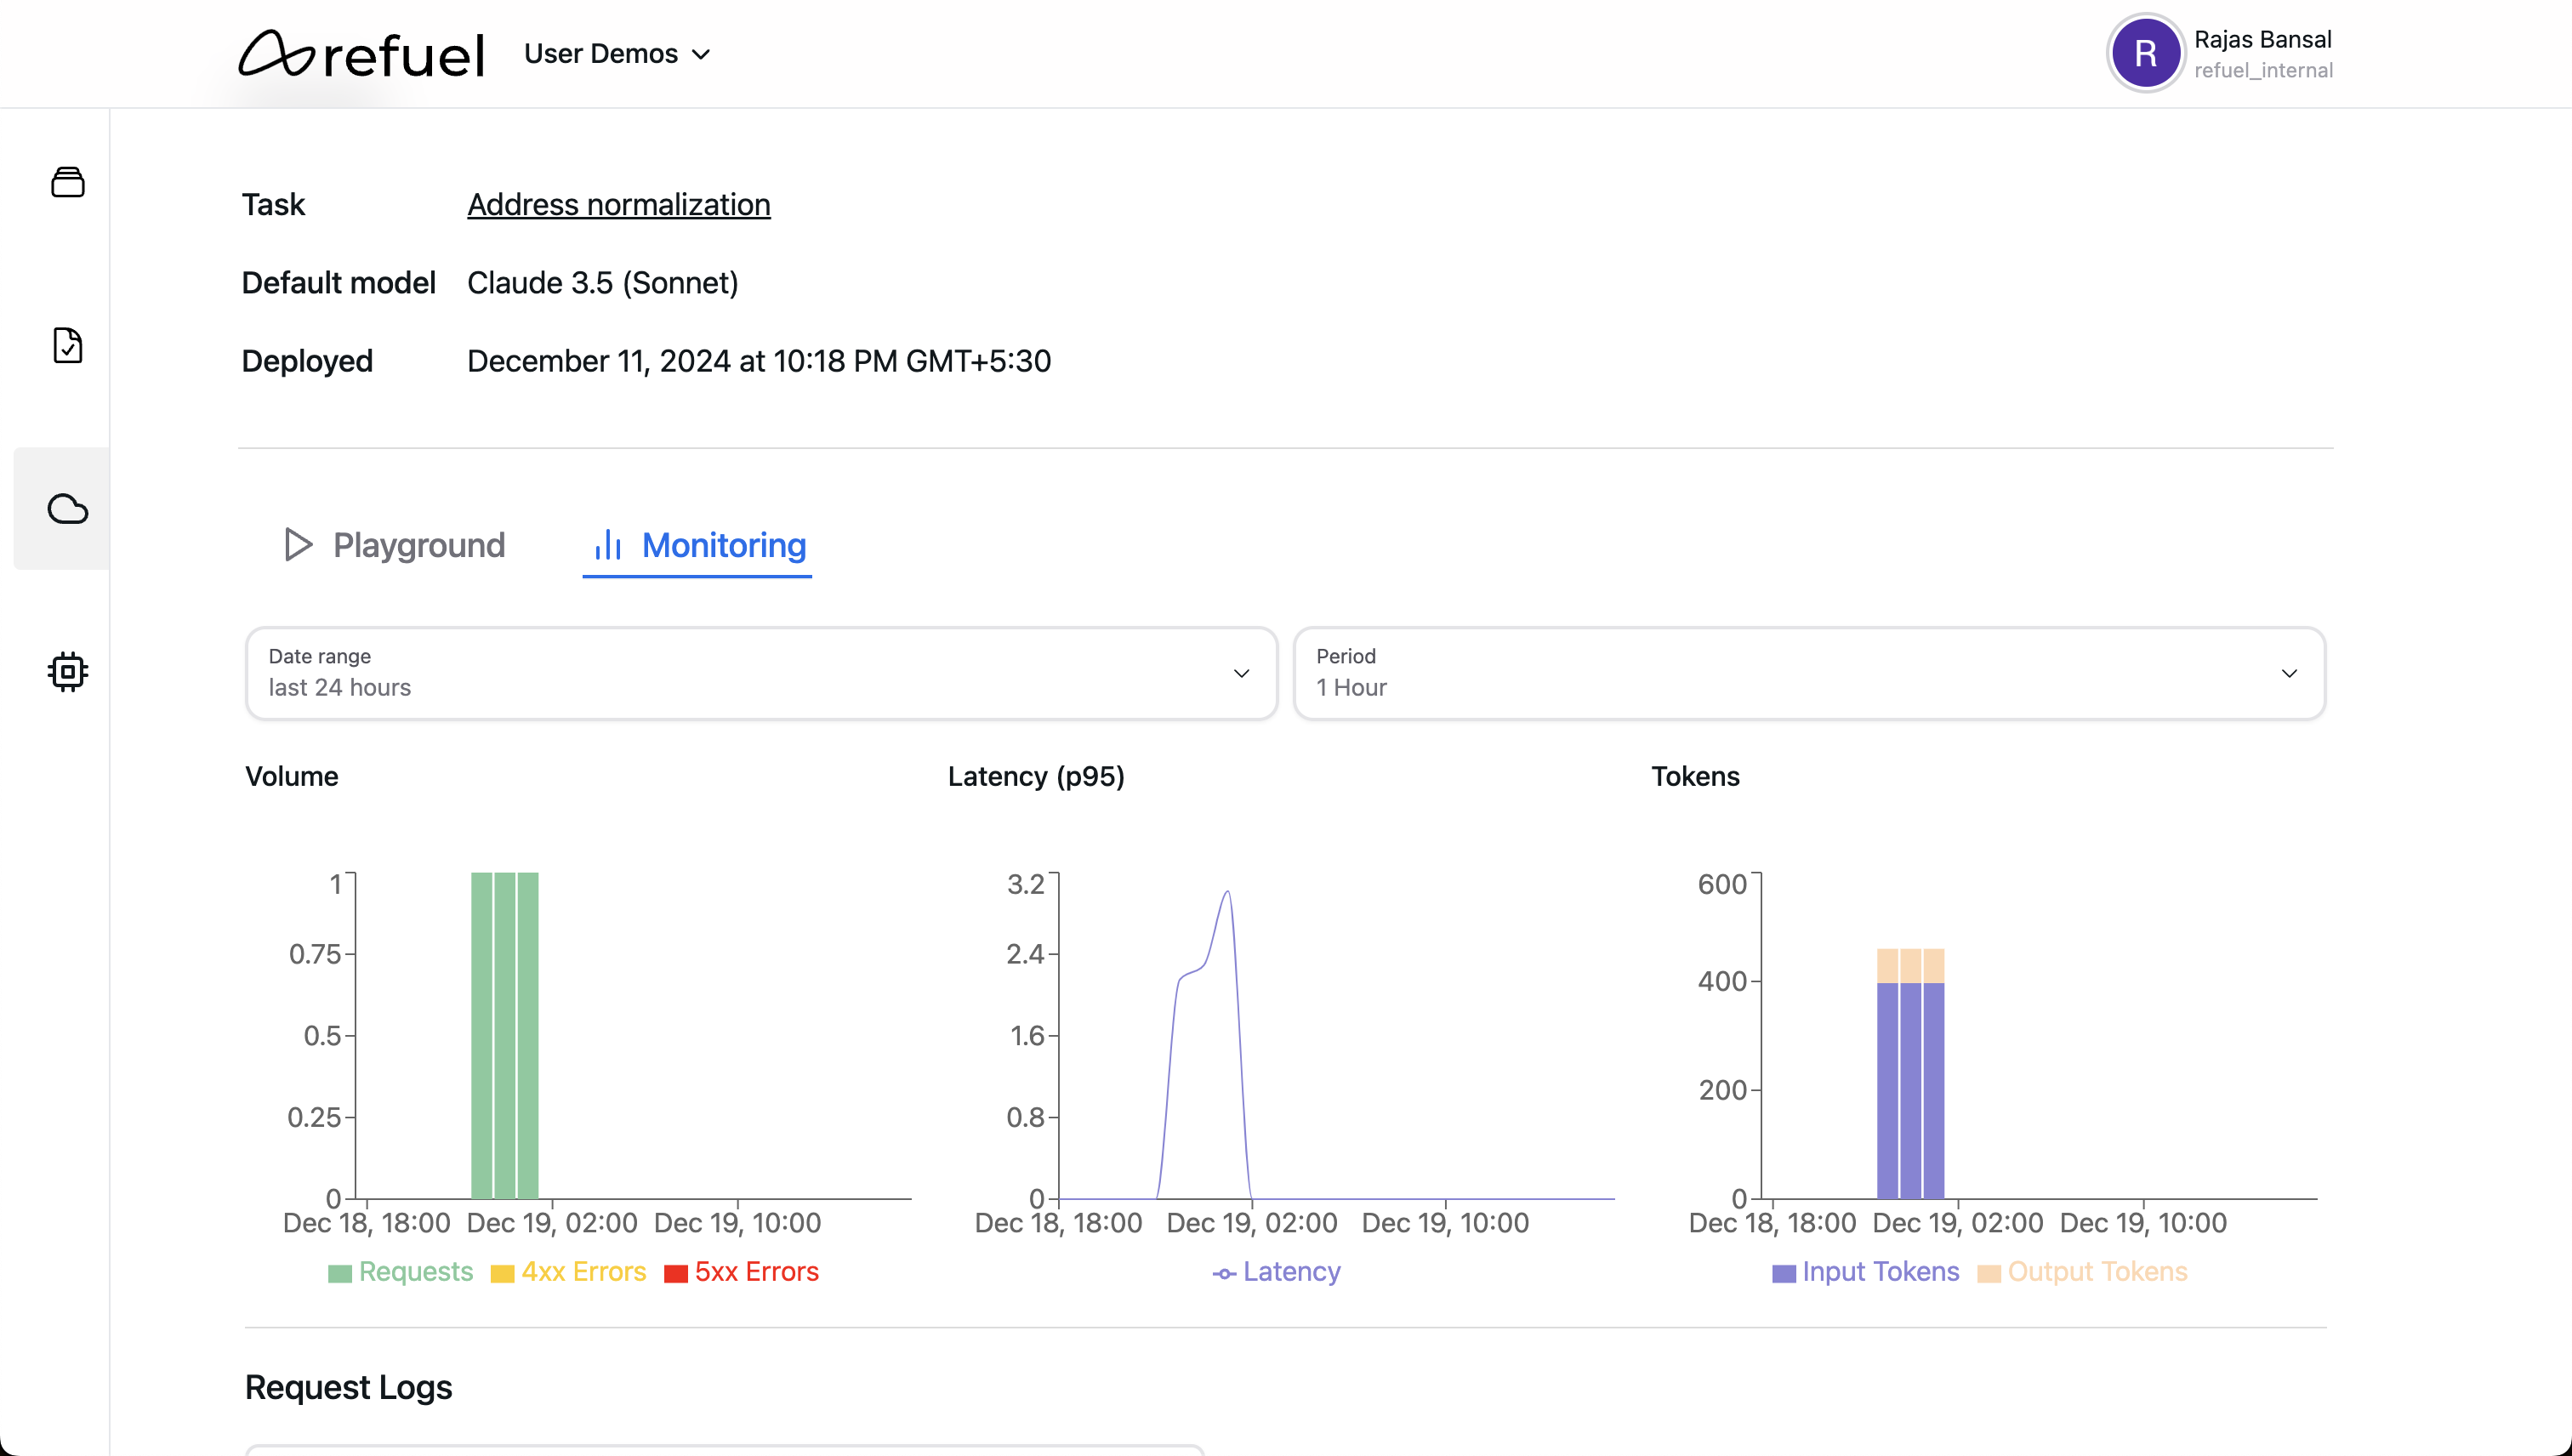
This pane contains metrics to understand the health and performance of your application. There are 3 metrics that are displayed:- Volume: The number of requests made to your application in the specified time period. It also shows the number of 4xx and 5xx errors that occured.
- Latency: This shows the 95th percentile latency (p95) of requests to your application.
- Tokens: This shows the number of input and output tokens used by your application in the specified time period.
- Date range: This is the time period over which the metrics are displayed. This can range from the last 24 hours to the last 90 days.
- Period: This is the time period over which the metrics are aggregated. For eg, if the period is selected as 1 hour, the latency would correspond to the 95th percentile latency of requests in the last hour.